What this demonstrates
- Immediate readability without sending someone back to a spreadsheet.
- Evidence on the page through visible tables and segment labels.
- Commercial targeting through charts that make the best-fit audiences obvious.
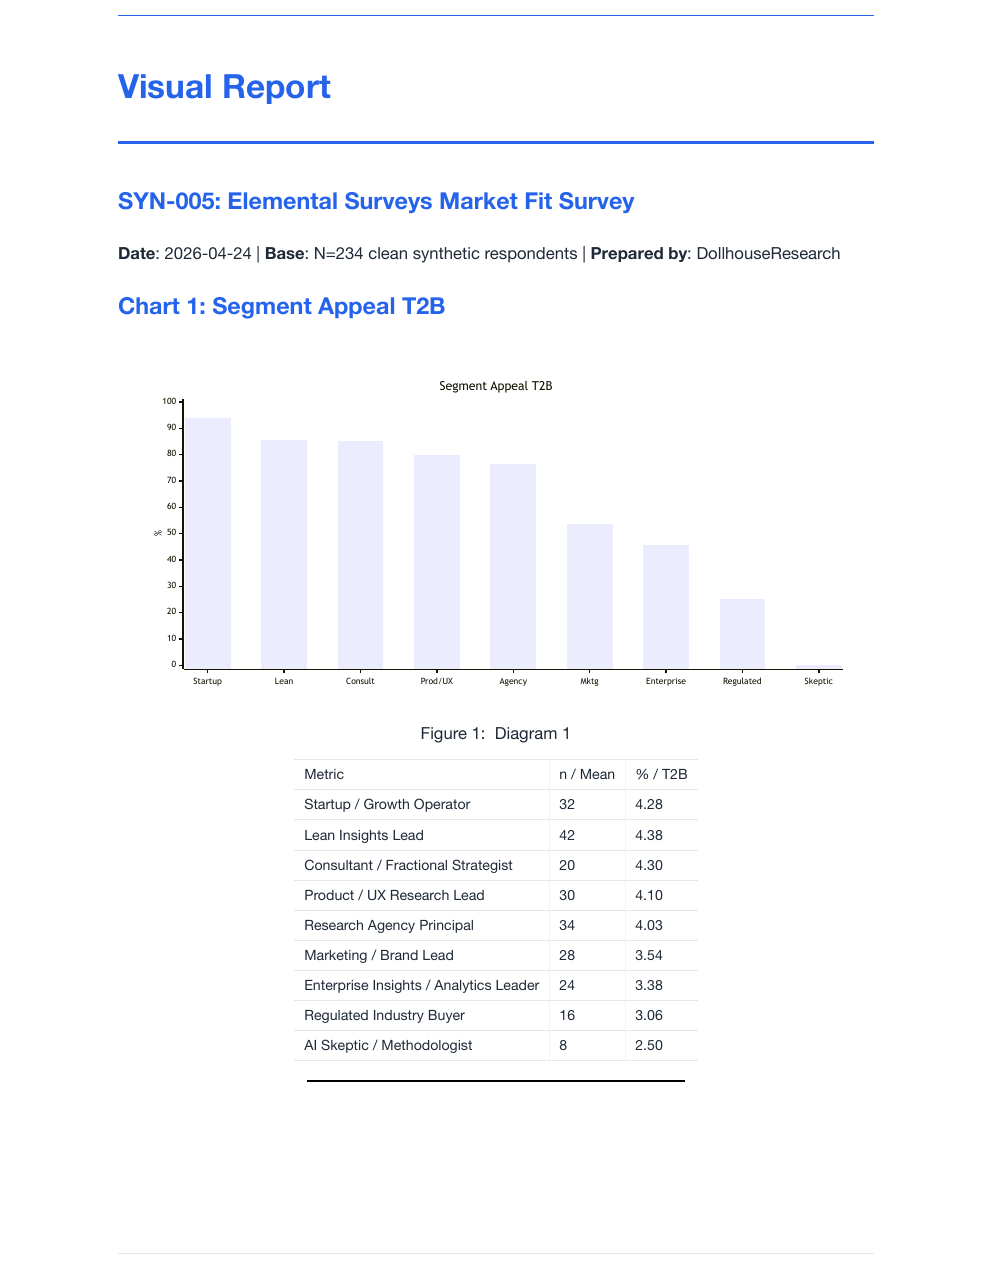
Visual Report Sample
This sample comes from SYN-005, a public-safe market-fit study about Elemental Surveys itself. The important thing is not just that the charts are attractive. It is that the page is interpretable on first contact.
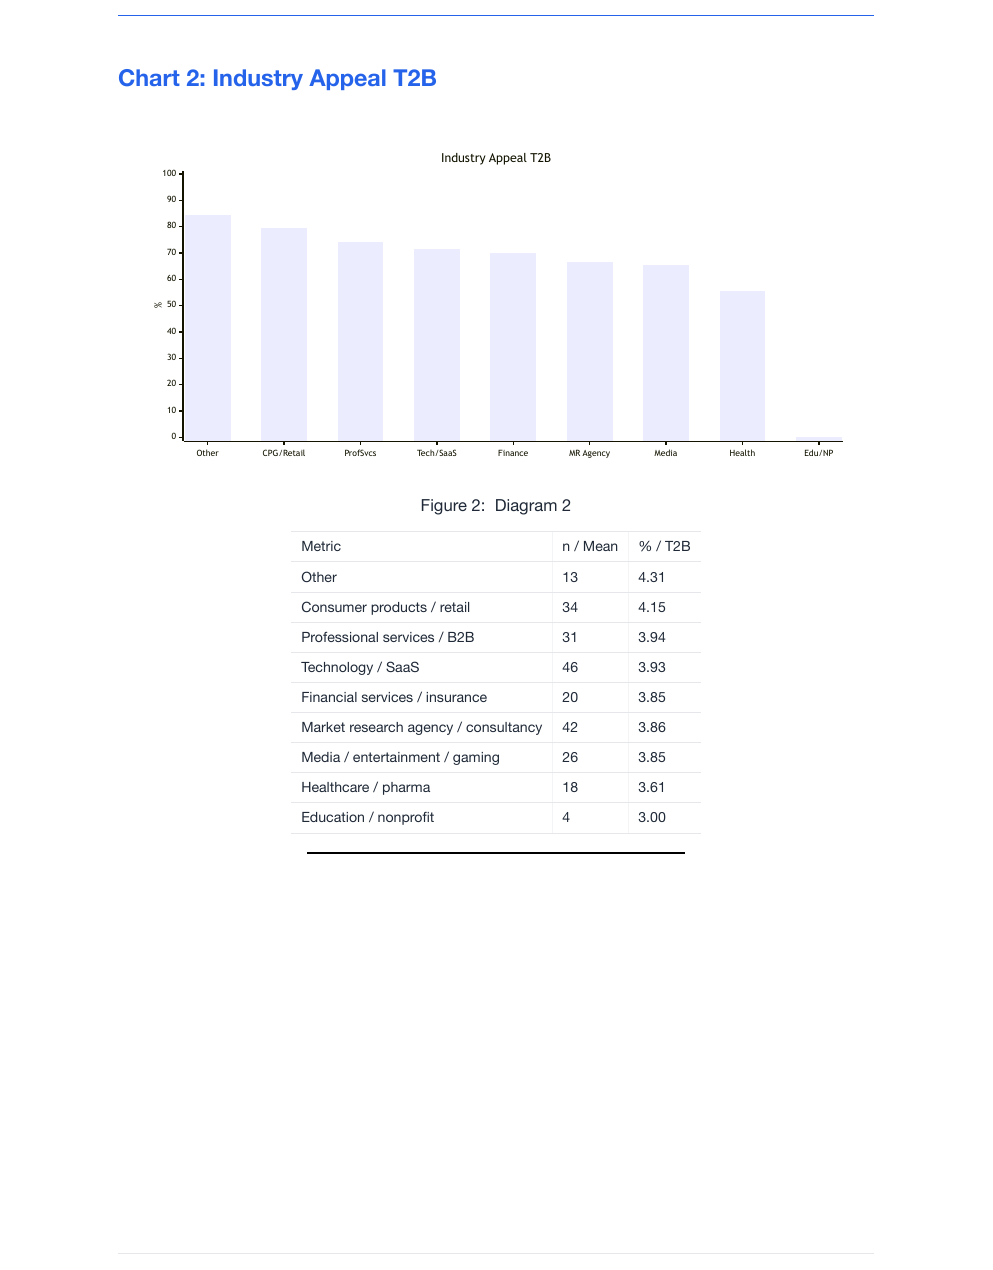
These excerpts show where demand appears strongest and how the page keeps the chart and supporting evidence together.
A lot of research output falls apart in the last mile. The data may be fine, but the page does not help the reader act. These pages are closer to the standard Elemental Surveys should hit every time: legible on first read and useful in a decision meeting.
If someone only looks at the exported PDF, the work should still feel coherent and commercially usable.
We can help scope the right deliverable format for the kind of question you need to answer.